Quickstart#
This example loads the IMD best-track record, explores the tidy tables, plots a cyclone track, and shows the xarray view. It runs end-to-end when the docs are built, so every output below is real.
import imdtrack as imd

bt = imd.load()
bt
<BestTracks: 428 storms, 7571 fixes, 1982-2026>
The tidy observations frame#
One row per 3-hourly fix, with a stable storm_id ("<year>-<serial>").
bt.observations.head()
| storm_id | year | serial | basin | name | time | lat | lon | ci_no | pressure | wind | pressure_drop | oci | oci_diameter | grade | step | pos_suspect | date_suspect | |
|---|---|---|---|---|---|---|---|---|---|---|---|---|---|---|---|---|---|---|
| 0 | 1982-001 | 1982 | 1 | BOB | NaN | 1982-05-01 03:00:00 | 14.0 | 82.5 | 1.5 | NaN | 25.0 | 3.0 | NaN | NaN | D | 0 | False | False |
| 1 | 1982-001 | 1982 | 1 | BOB | NaN | 1982-05-01 06:00:00 | 14.5 | 82.5 | 2.0 | NaN | 30.0 | 5.0 | NaN | NaN | DD | 1 | False | False |
| 2 | 1982-001 | 1982 | 1 | BOB | NaN | 1982-05-01 12:00:00 | 15.0 | 82.0 | 2.5 | NaN | 35.0 | 6.0 | NaN | NaN | CS | 2 | False | False |
| 3 | 1982-001 | 1982 | 1 | BOB | NaN | 1982-05-01 18:00:00 | 15.5 | 82.5 | 2.5 | NaN | 40.0 | 8.0 | NaN | NaN | CS | 3 | False | False |
| 4 | 1982-001 | 1982 | 1 | BOB | NaN | 1982-05-02 00:00:00 | 16.0 | 83.0 | 3.0 | NaN | 45.0 | 10.0 | NaN | NaN | CS | 4 | False | False |
Storm-level summary#
One row per storm: peak grade, max wind, min pressure, start/end time.
bt.storms.tail()
| storm_id | year | serial | name | basin | start_time | end_time | n_obs | max_wind | min_pressure | peak_grade | |
|---|---|---|---|---|---|---|---|---|---|---|---|
| 423 | 2025-012 | 2025 | 12 | NaN | ARB | 2025-10-22 00:00:00 | 2025-10-31 18:00:00 | 50 | 25.0 | 1000.0 | D |
| 424 | 2025-013 | 2025 | 13 | MONTHA | BOB | 2025-10-25 00:00:00 | 2025-10-29 18:00:00 | 32 | 50.0 | 990.0 | SCS |
| 425 | 2025-014 | 2025 | 14 | SENYAR | BOB | 2025-11-25 03:00:00 | 2025-11-27 15:00:00 | 17 | 40.0 | 999.0 | CS |
| 426 | 2025-015 | 2025 | 15 | DITWAH | BOB | 2025-11-26 18:00:00 | 2025-12-02 18:00:00 | 41 | 40.0 | 1000.0 | CS |
| 427 | 2026-001 | 2026 | 1 | NaN | BOB | 2026-01-07 03:00:00 | 2026-01-10 12:00:00 | 18 | 30.0 | 1004.0 | DD |
Plot a cyclone track#
The optional [plot] extra (pip install imdtrack[plot]) draws
publication-quality Cartopy maps — the track is coloured by IMD category,
with genesis/peak/end marked. Look storms up by id or name:
imd.plot_track(bt.storm("tauktae"), color="grade", annotate=True)
<GeoAxes: >
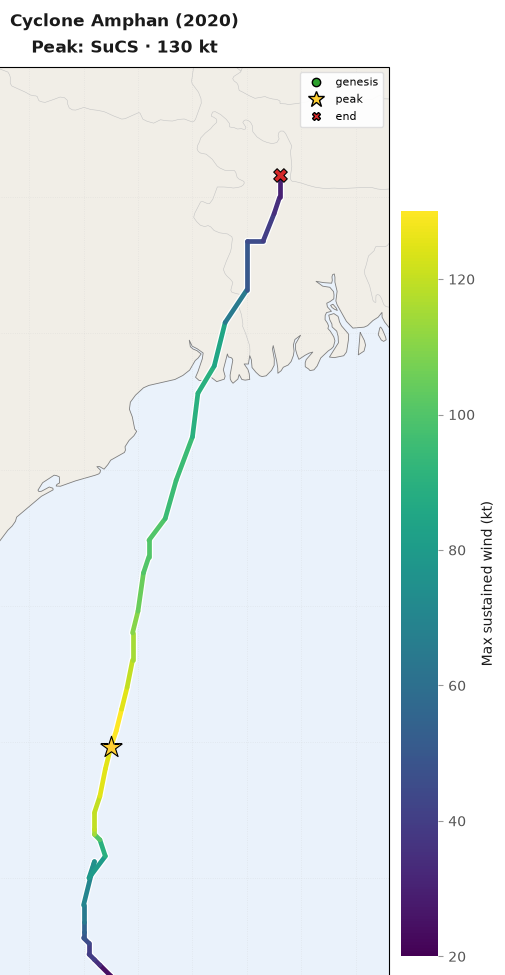
…or colour by wind speed instead (the title is generated from the storm):
imd.plot_track(bt.storm("2020-001"), color="wind")
<GeoAxes: >
The xarray Dataset#
A ragged track becomes a 2-D (storm, step) grid, IBTrACS-style.
ds = bt.to_xarray()
ds
<xarray.Dataset> Size: 3MB
Dimensions:        (storm: 428, step: 97)
Coordinates:
  * storm          (storm) object 3kB '1982-001' '1982-002' ... '2026-001'
    name           (storm) object 3kB '' '' '' '' ... 'SENYAR' 'DITWAH' ''
    basin          (storm) object 3kB 'BOB' 'BOB' 'BOB' ... 'BOB' 'BOB' 'BOB'
    year           (storm) int64 3kB 1982 1982 1982 1982 ... 2025 2025 2025 2026
    serial         (storm) int64 3kB 1 2 3 4 5 6 7 8 9 ... 9 10 11 12 13 14 15 1
    peak_grade     (storm) object 3kB 'VSCS' 'VSCS' 'DD' 'D' ... 'CS' 'CS' 'DD'
  * step           (step) int64 776B 0 1 2 3 4 5 6 7 ... 89 90 91 92 93 94 95 96
Data variables:
    time           (storm, step) datetime64[ns] 332kB 1982-05-01T03:00:00 ......
    lat            (storm, step) float64 332kB 14.0 14.5 15.0 ... nan nan nan
    lon            (storm, step) float64 332kB 82.5 82.5 82.0 ... nan nan nan
    ci_no          (storm, step) float64 332kB 1.5 2.0 2.5 2.5 ... nan nan nan
    pressure       (storm, step) float64 332kB nan nan nan nan ... nan nan nan
    wind           (storm, step) float64 332kB 25.0 30.0 35.0 ... nan nan nan
    pressure_drop  (storm, step) float64 332kB 3.0 5.0 6.0 8.0 ... nan nan nan
    grade          (storm, step) object 332kB 'D' 'DD' 'CS' 'CS' ... '' '' '' ''
    oci            (storm, step) float64 332kB nan nan nan nan ... nan nan nan
    oci_diameter   (storm, step) float64 332kB nan nan nan nan ... nan nan nan
Attributes:
    title:              IMD RSMC New Delhi best track data
    source:             India Meteorological Department (rsmcnewdelhi.imd.gov...
    featureType:        trajectory
    n_storms:           428
grade_definitions: D=Depression; DD=Deep Depression; CS=Cyclonic Storm; ...Slice one storm and get its peak intensity:
ds.sel(storm="2020-001")["wind"].max().item()
130.0
Data quality#
The dataset mirrors the IMD workbook faithfully, including its occasional
data-entry errors, which are flagged non-destructively: pos_suspect marks
fixes whose coordinates imply an impossible jump, and date_suspect marks
day/month-transposed dates. Inspect them, or clean them on demand:
flagged = bt.observations.query("pos_suspect or date_suspect")
print(
    f"{len(flagged)} flagged fixes "
    f"({int(bt.observations['pos_suspect'].sum())} position, "
    f"{int(bt.observations['date_suspect'].sum())} date)"
)
105 flagged fixes (2 position, 103 date)
# Drop the coordinate spikes and swap day/month-transposed dates back into order.
clean = imd.load().clean(fix_dates=True)
clean
<BestTracks: 428 storms, 7569 fixes, 1982-2026>