Track plotting gallery#
The optional [plot] extra (pip install imdtrack[plot]) adds Cartopy maps
via imd.plot_track (one storm) and imd.plot_tracks (many). Tracks are drawn
as intensity-coloured lines over a clean basemap — tropycal-style, but using
IMD grades. Everything below runs on the committed dataset.
import imdtrack as imd

bt = imd.load().clean(fix_dates=True)
A single track, coloured by IMD category#
Storms can be looked up by storm_id or name (case-insensitive). Genesis
(●), lifetime peak (★) and dissipation (✖) are marked; annotate=True labels
them.
imd.plot_track(bt.storm("tauktae"), color="grade", annotate=True)
<GeoAxes: >
/home/docs/checkouts/readthedocs.org/user_builds/imdtrack/envs/stable/lib/python3.12/site-packages/cartopy/io/__init__.py:242: DownloadWarning: Downloading: https://naturalearth.s3.amazonaws.com/50m_physical/ne_50m_ocean.zip
  warnings.warn(f'Downloading: {url}', DownloadWarning)
/home/docs/checkouts/readthedocs.org/user_builds/imdtrack/envs/stable/lib/python3.12/site-packages/cartopy/io/__init__.py:242: DownloadWarning: Downloading: https://naturalearth.s3.amazonaws.com/50m_physical/ne_50m_land.zip
  warnings.warn(f'Downloading: {url}', DownloadWarning)
/home/docs/checkouts/readthedocs.org/user_builds/imdtrack/envs/stable/lib/python3.12/site-packages/cartopy/io/__init__.py:242: DownloadWarning: Downloading: https://naturalearth.s3.amazonaws.com/50m_physical/ne_50m_coastline.zip
  warnings.warn(f'Downloading: {url}', DownloadWarning)
/home/docs/checkouts/readthedocs.org/user_builds/imdtrack/envs/stable/lib/python3.12/site-packages/cartopy/io/__init__.py:242: DownloadWarning: Downloading: https://naturalearth.s3.amazonaws.com/50m_cultural/ne_50m_admin_0_boundary_lines_land.zip
  warnings.warn(f'Downloading: {url}', DownloadWarning)
…or coloured by wind speed#
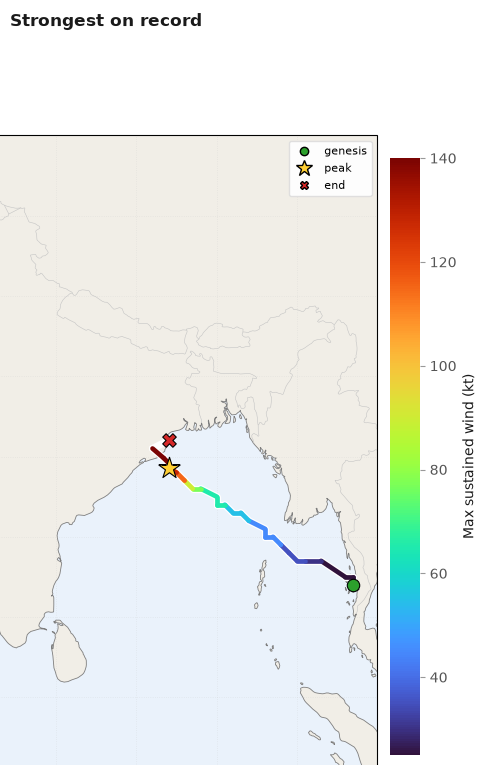
The strongest storm on record — the 1999 Odisha super cyclone (140 kt). Pass
extent=[lon0, lon1, lat0, lat1] to frame the whole basin (rather than
auto-fitting the track) and title="…" for your own title.
strongest = bt.storms.loc[bt.storms["max_wind"].idxmax(), "storm_id"]
imd.plot_track(
    bt.storm(strongest),
    color="wind",
    cmap="turbo",
    extent=[60, 100, 0, 40],
    title="Strongest on record",
)
<GeoAxes: >
Every track on one map, by sub-basin#
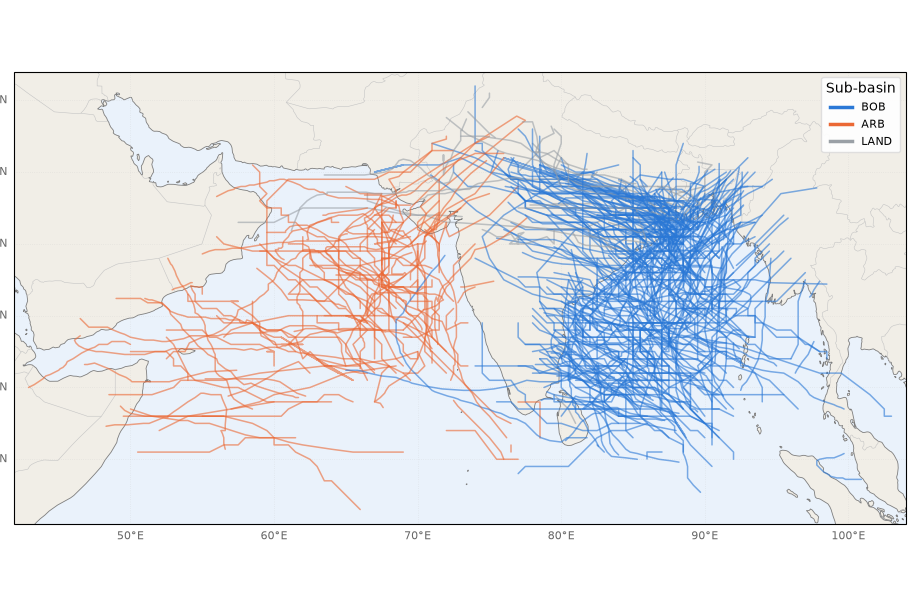
plot_tracks overlays the whole archive; colour by "basin" (Bay of Bengal
vs Arabian Sea) …
imd.plot_tracks(
    bt.observations, color="basin", title="North Indian Ocean best tracks, 1982–present"
)
<GeoAxes: title={'center': 'North Indian Ocean best tracks, 1982–present'}>
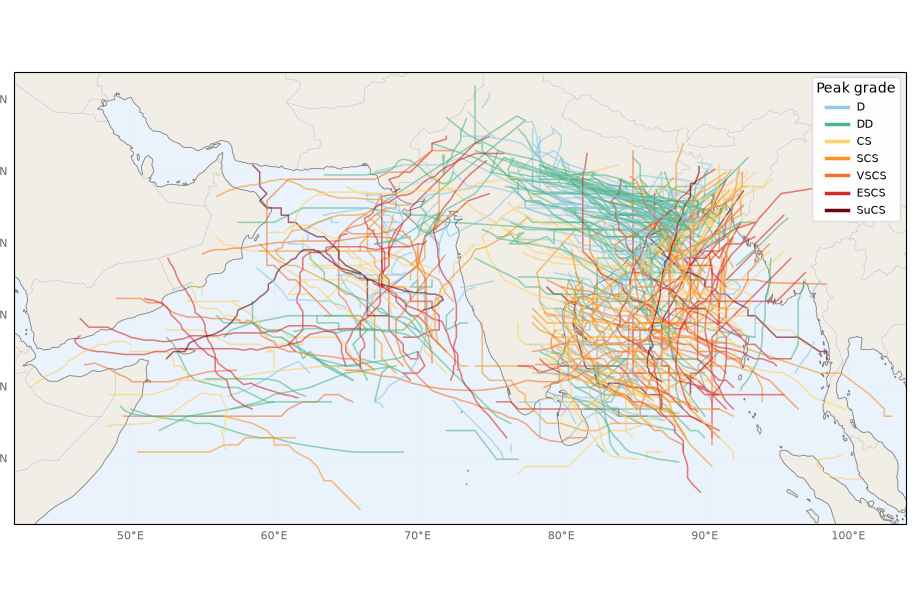
… or by each storm’s peak intensity#
imd.plot_tracks(bt.observations, color="grade", title="Tracks by peak IMD grade")
<GeoAxes: title={'center': 'Tracks by peak IMD grade'}>
Both functions accept an existing Cartopy ax (pass ax=...) and an extent
[lon0, lon1, lat0, lat1], so you can compose them into multi-panel figures or
zoom to a region.